Quick start with Gizwits IoT Cloud
Edit
Overview
This document mainly introduces the process of self-service access to Gizwits, and helps you to quickly understand the principle of access to the Gizwits IoT Cloud through the provided example project “Gizwits Debugging App controls a virtual device in cloud”. Even if you have not yet developed any device, you can also get started rapidly.
Gizwits Access Process

1. Register as a developer of Gizwits
Before using the Gizwits IoT Cloud services, you need to register a Gizwits developer account first. Click here to register.
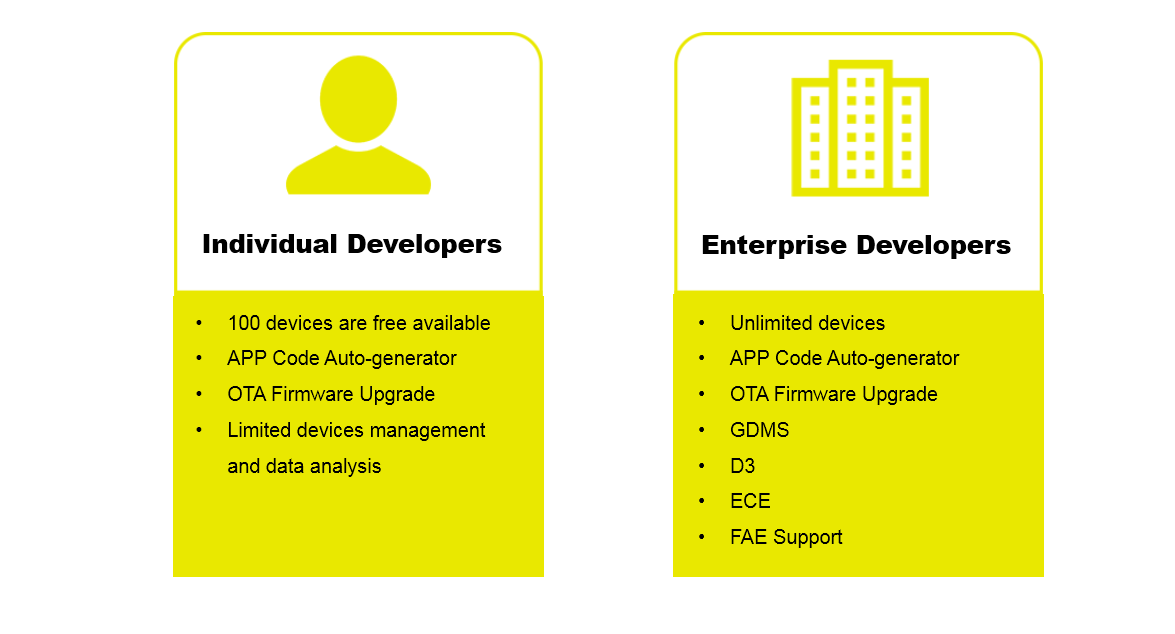
Gizwits offers individual developer account and enterprise developer account, as shown in the figure below. If you are a enterprise user, please be sure to sign up for a enterprise developer account (which provides more services).

2. Create a product
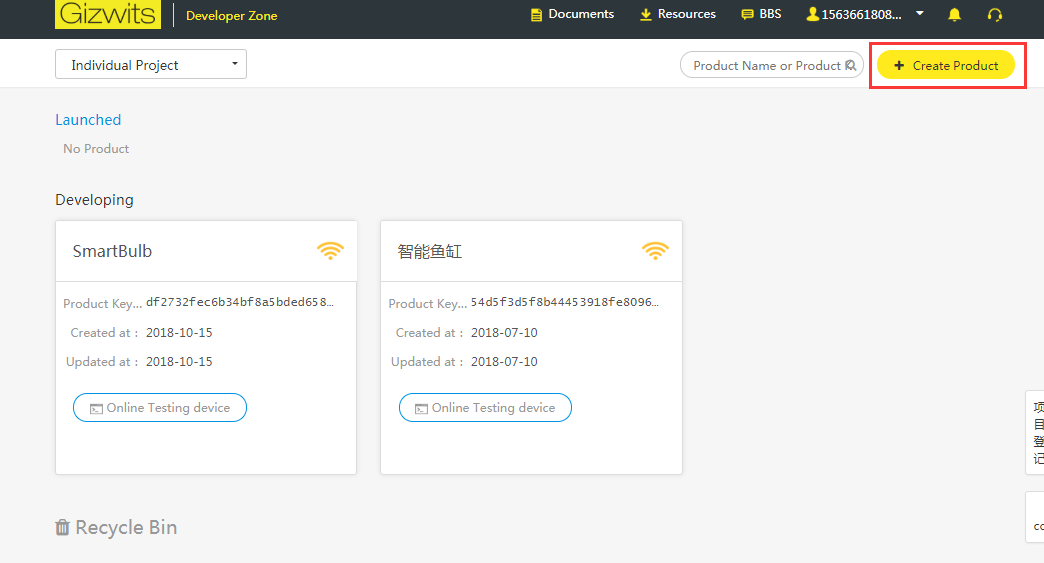
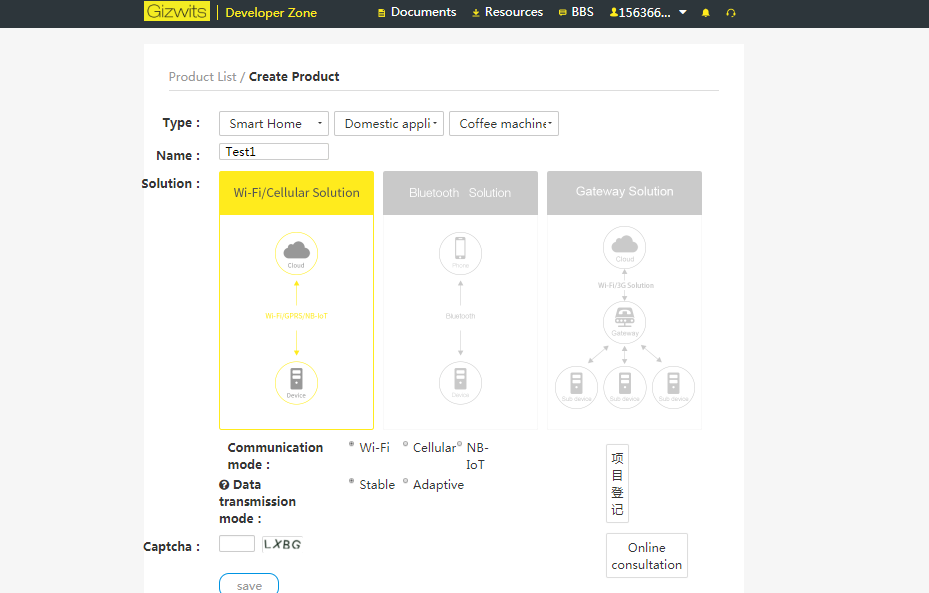
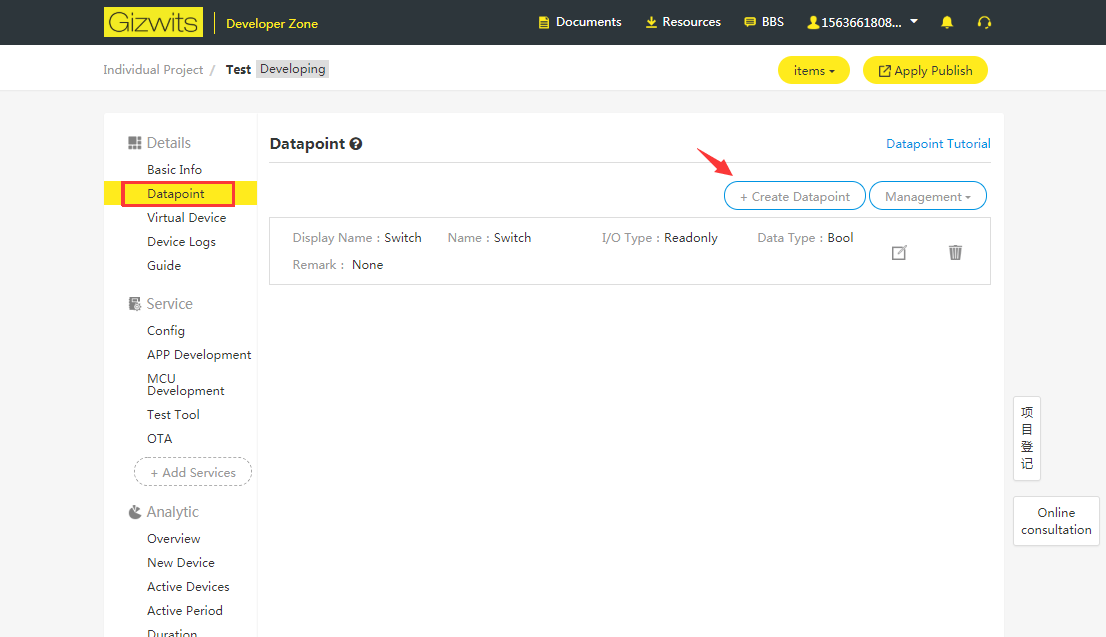
As shown in the figure, click “Create a new product” in the Developer Center, enter the product name and select the corresponding access method to complete the creation of the “new product.” The created product needs to define the product Data Points. The Data Points refers to the functional abstraction that the product has, which are represented by different data types. For example, the simplest device “switch” has the following functions: On and Off, which can be abstracted as one Data Point with boolean type. 0 means On, 1 means Off.
Data Points are an important attribute of a product. Therefore, the first step for product intellectualization is to clarify product functions and create corresponding Data Points on the platform to describe its functions. Subsequently, the MCU protocol for embedded development will be generated automatically based on the created Data Points. According to the automatically generated protocol, developers can complete the development of smart devices.
Step 1: Click “Create a new product”

Step 2: Type the product name and select an access method

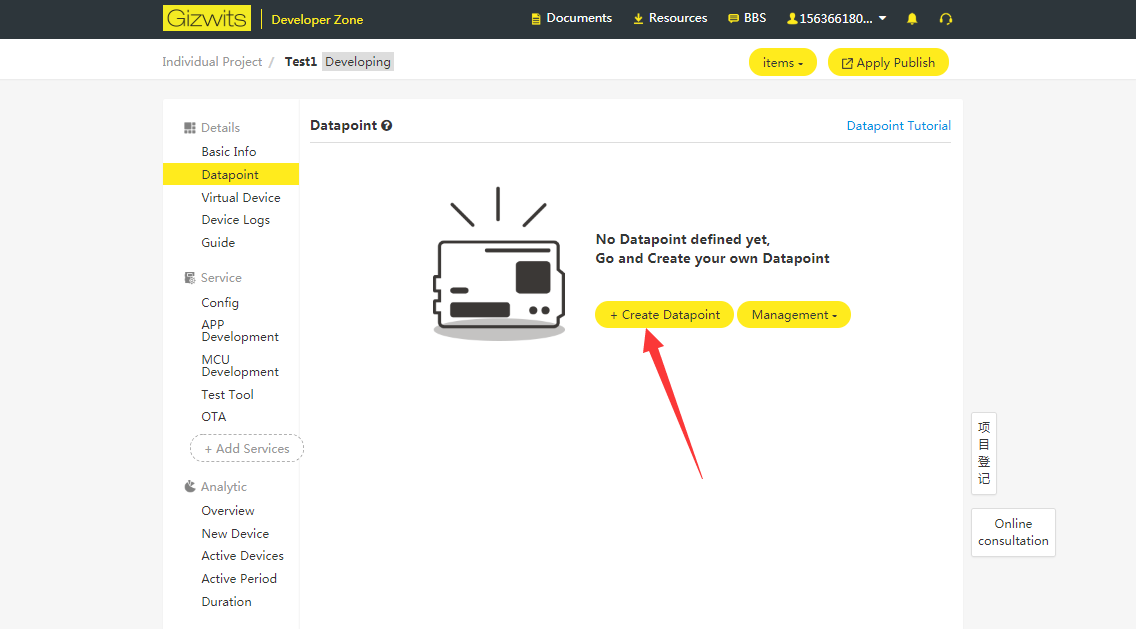
Step 3: Create Data Points

Click “New Data Point” to add switch on/off Data Point.

For further information of this step, please click here for reference.
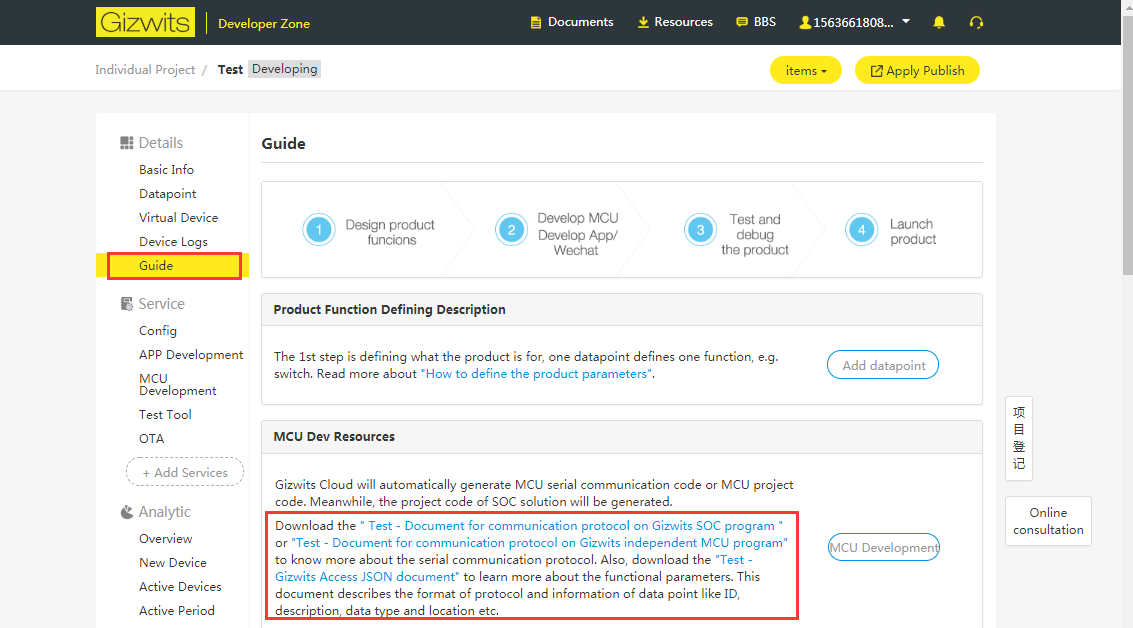
Step 4: Download the automatically generated protocol by the cloud
As shown in the figure, click “Development wizard” in the Developer Center to find the MCU development resources to view the protocol automatically generated by the cloud based on the defined Data Points.

3. Device and Application Development
Device connection

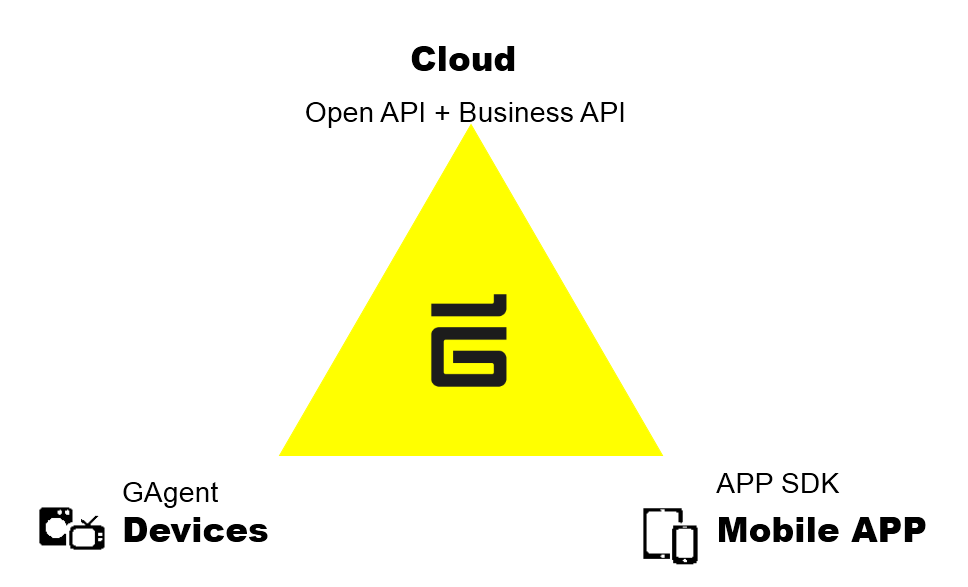
Developers or R&D personnel of enterprises simply download the connectivity firmware - Gizwits GAgent to the communication module of your smart device, so that devices can be connected to Gizwits IoT Cloud and intelligentized. The communication modules include Wi-Fi, GPRS and other mainstream networking types. Other connection solutions are also available, such as BLE, GSM, CDMA, Zigbee, and LoRa.
The example project of this document focuses on Wi-Fi devices. To speed up R&D, it is recommended to use Gizwits certified modules and GAgent. Click here for reference.
Application connection
Developers or R&D personnel of enterprises simply integrate the Gizwits App SDK provided by Gizwits into the mobile applications being developed, which then can connect to the Gizwits IoT Cloud to control smart devices.
This document comes with a case to go into details on how to use Gizwits Debugging App to control devices. If you want to quickly develop an App, it is recommended to use the Gizwits App Framework provided by Gizwits for rapid development.
4. Debugging products
After product creation in the Developer Center, you can launch smart product development with the help of related technical documents in Gizwits Documentation Center.
During debugging, the device will be connected to the Gizwits sandbox server (test server), which provides the developer with a complete testing environment and some functions of Gizwits. After the product development is completed, it is required to request to release, and the completed product will be redeployed to the production server.
5. Product release
When your product development is completed, you can request to release your product. The product will be deployed on the servers of the official production environment of Gizwits, and an independent cloud operating environment will be allocated for your device for free, ensuring that your devices is available 24 hours a day for end users. At the same time, after the products are officially released, you will enjoy more free value-added services frome Gizwits, including statistical analysis of smart devices, open platform display, and various meticulous technical support services.

6. Mass production
After the product release, the manufacturers and Gizwits sign the “GDCS Agreement” to formally mass-manufacture the product and connect them. The mass-manufactured products will be monitored by Gizwits technicians for 24 hours to ensure the stable operation.
Getting Started
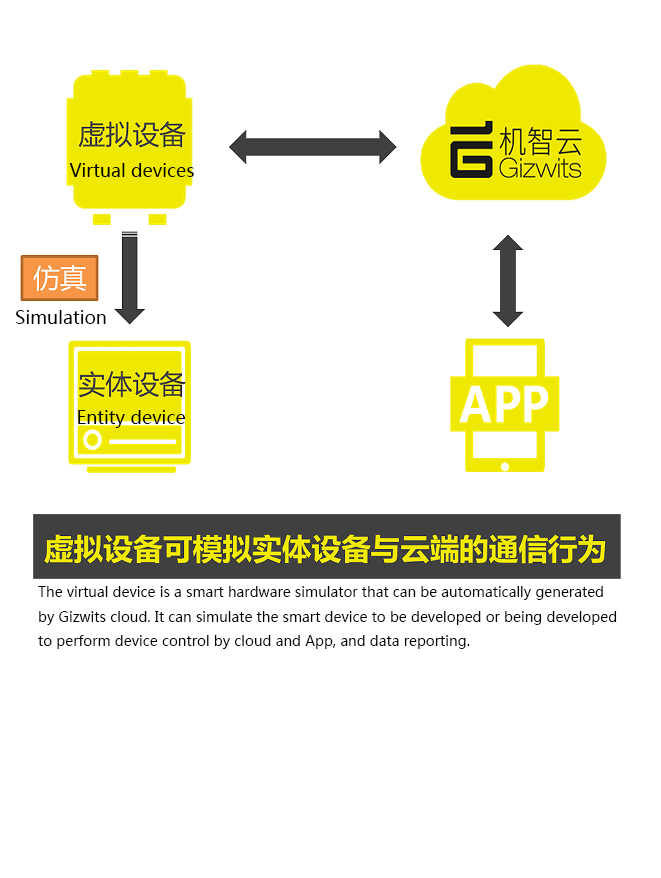
Gizwits Self-service Development Platform provides a complete suite of simulation development tools, including virtual devices and Gizwits Debugging App. Regardless of whether you have already completed a smart device, you can understand the principle of Gizwits access through virtual devices and Gizwits Debugging App when you use Gizwits for the first time, which allows you to experience intuitive services of Gizwits access.
The virtual device is a smart hardware simulator that can be automatically generated by Gizwits IoT Cloud. It can simulate the smart device to be developed or being developed to perform device control by cloud and App, and data reporting.

In the course of development, if the formal smart hardware product has not yet been fully completed, developers or R&D personnel of enterprises can use the “virtual device” to debug and verify its functions together with formal controlling Apps so as to accelerate R&D and reduce costs.
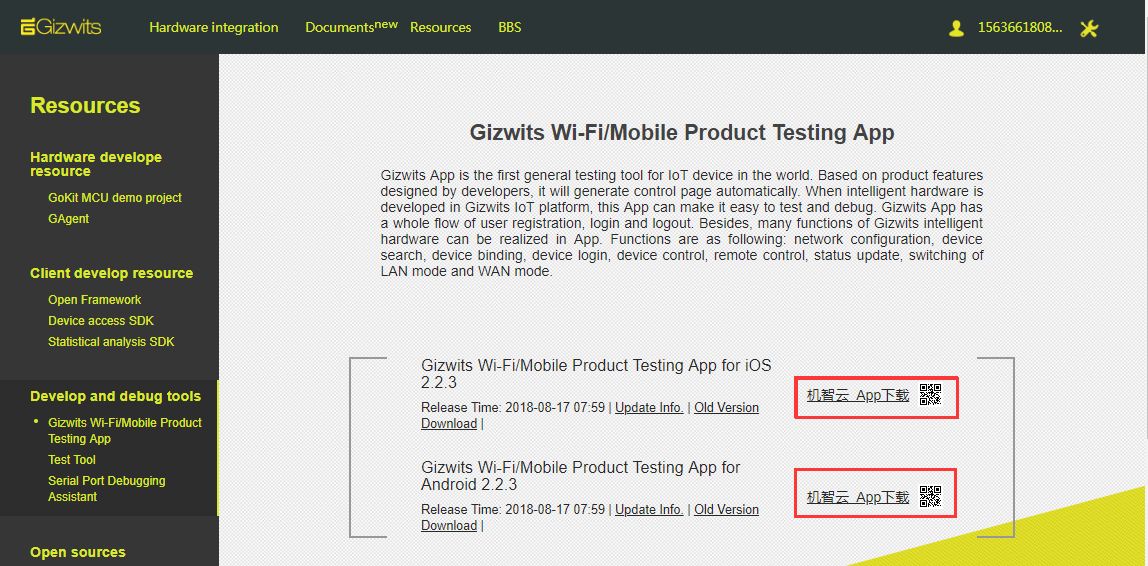
Gizwits debugging App is the world’s first-in-class debugging tool for IoT devices. Its functions can be customized according to the actual needs of smart hardware products. It can automatically generate responsive control pages with user registration, login, and logout processes, and complete the basic operations such as configuration of network access, device searching, device binding, device login, device control, remote control, status update and local/remote switching etc. for smart devices, as well as debugging.
During development, if the formal controlling App of the product is not yet fully developed, developers or R&D personnel of enterprises can easily use the Gizwits Debugging App to debug and verify the formal product functions, so as to accelerate the development and reduce costs.
In the following, we take the project “Gizwits Debugging App to control cloud-based virtual device” as an example, to get you familiar with the Gizwits connection service and complete the process of getting started. The detailed steps are as follows:
1. Install Gizwits Debugging App
Click here to download and install the Gizwits Debugging App.

2. Start the virtual device
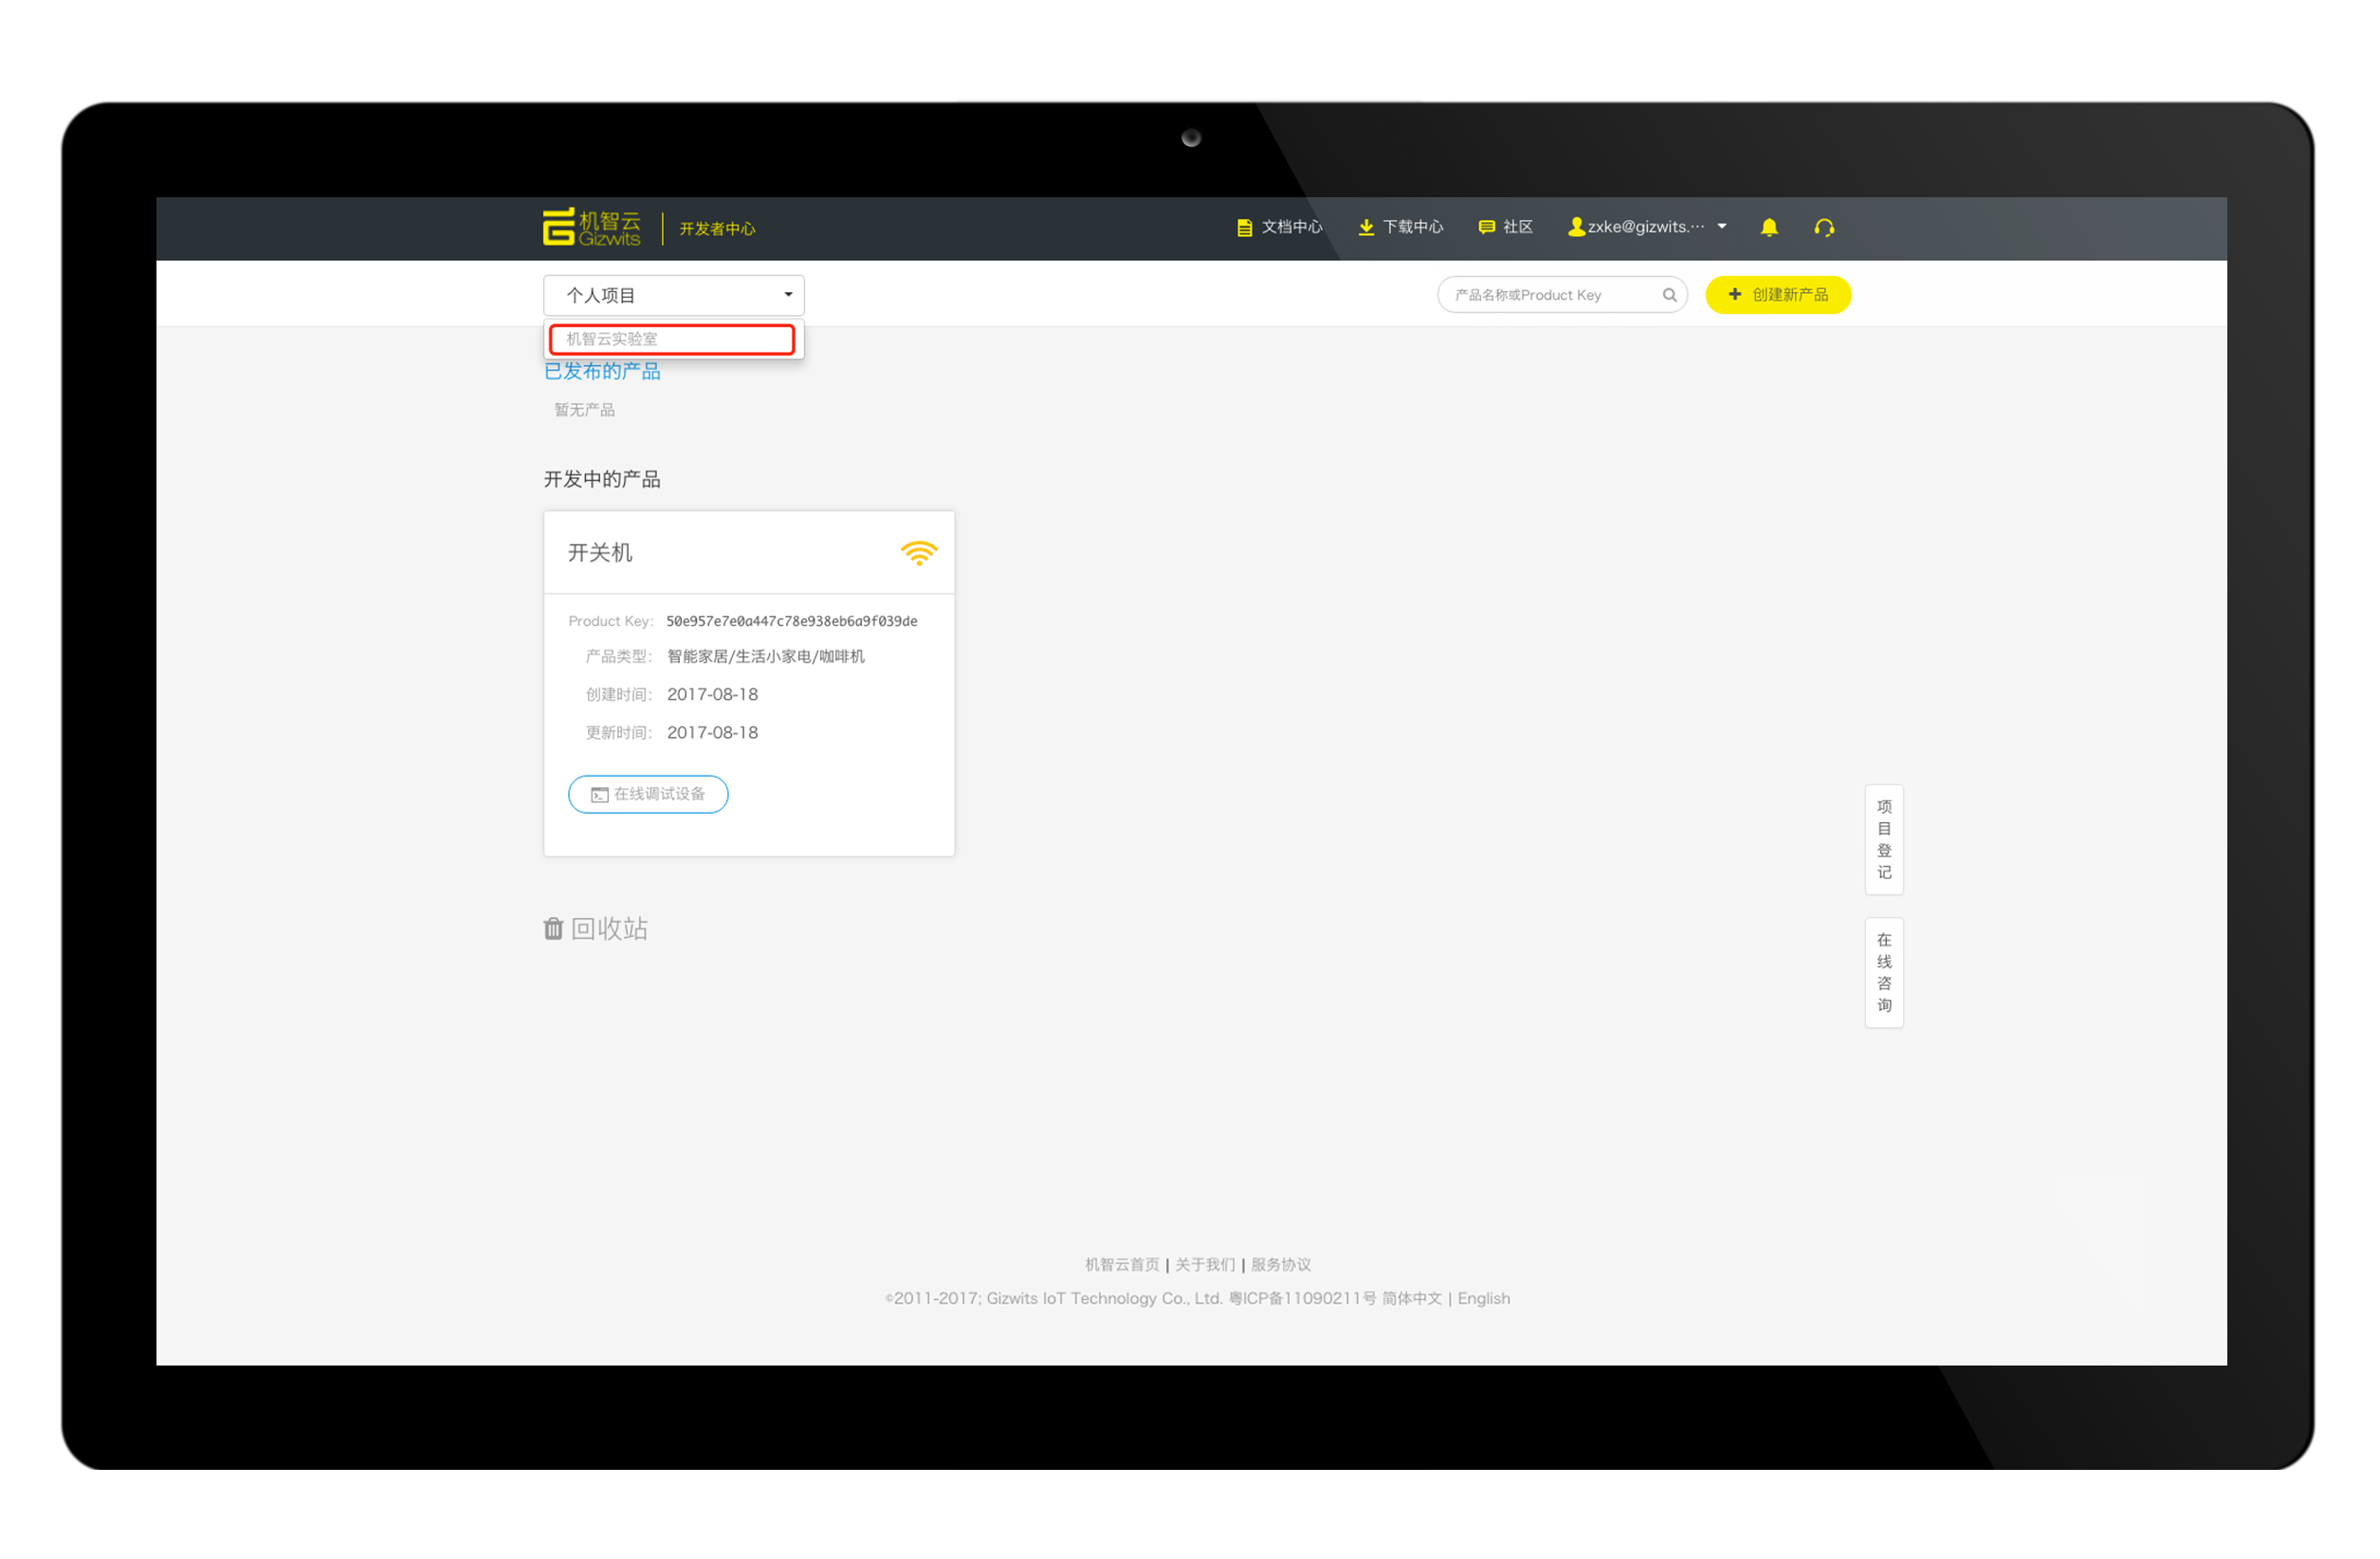
Step 1: Go to the Developer Center, click on the selection bar in the upper left corner and select “Gizwits lab”:

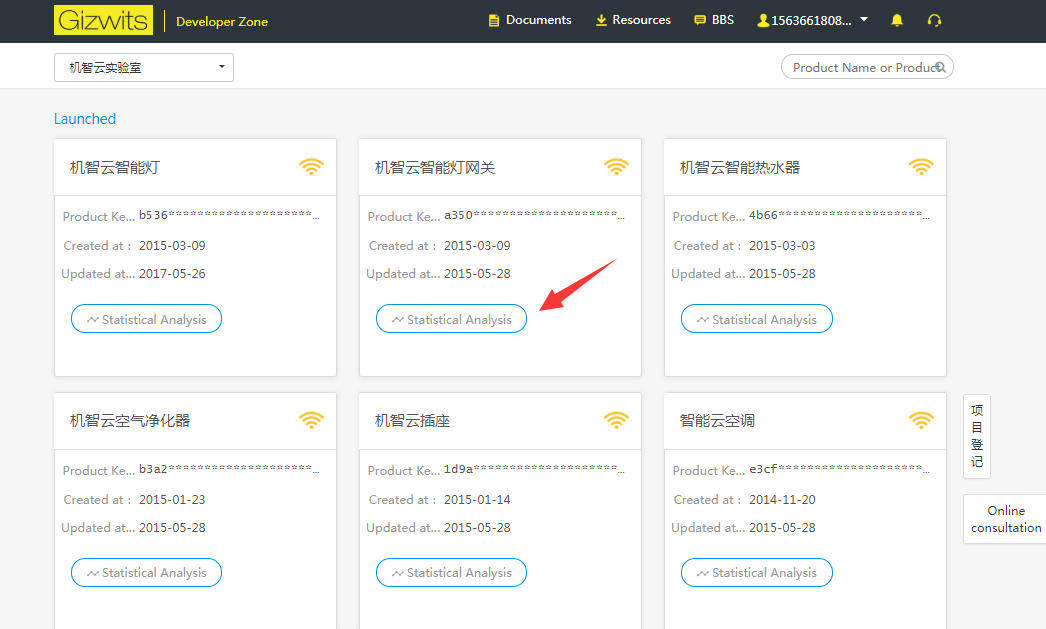
Step 2: Select a smart hardware product(a virtual device)
We recommend that novices choose those in “products under development” to simulate the real development process. You can choose any one in the section of “products under development” for practice.

We select “Smart Light” and click “Online device debugging” in the red box to jump to the next page “Virtual device”.
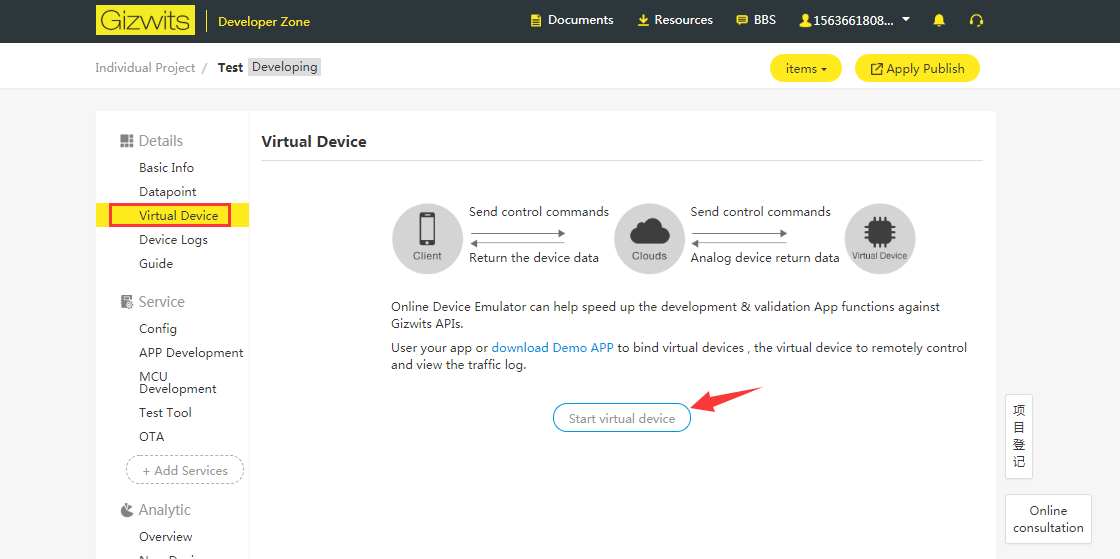
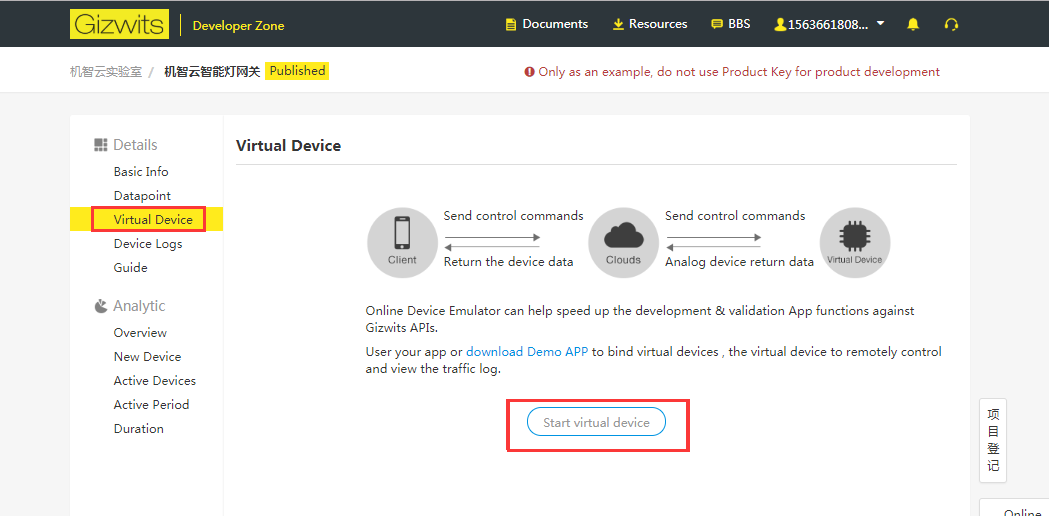
Step 3: Start the virtual device

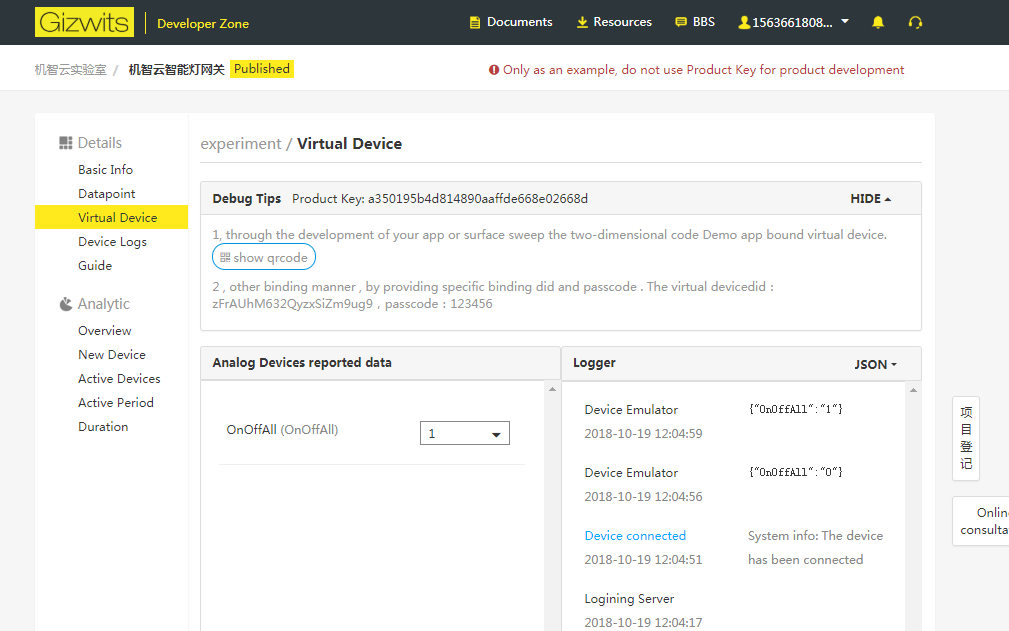
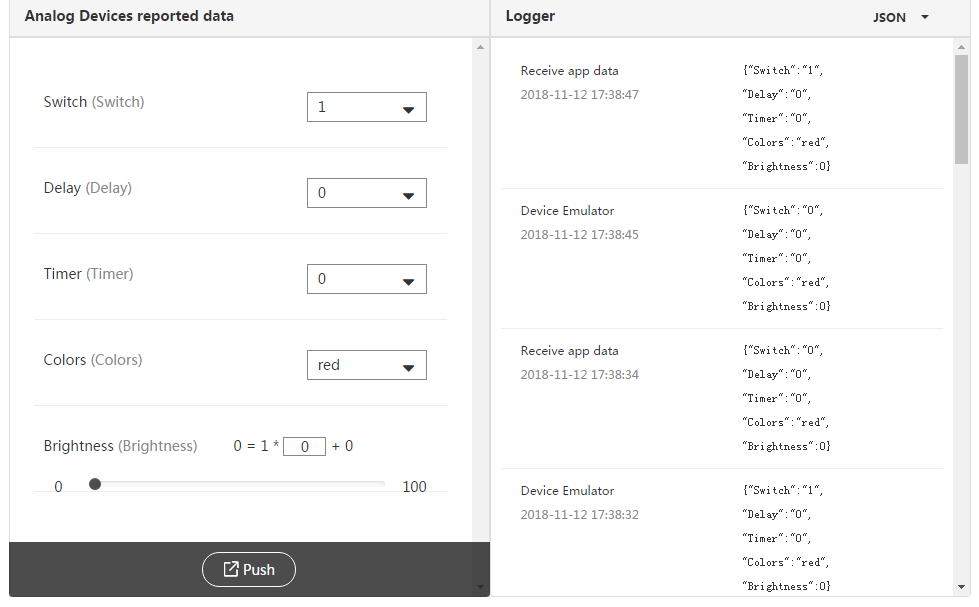
Click “Start virtual device” in the red box to navigate to online debugging page for the virtual device, you will see three functional areas of “Debug tips”, “Simulating device data reporting”, “Communication log”:
The button “Show QR Code” in the “Debug tips” is used to bind the virtual device to the Gizwits Debugging App.
“Simulating device data reporting” is used to report data by the virtual device in the Developer Center.
“Communication log” is used to display “Accept data sent by App” and “data reporting from virtual devices”

3. Use Gizwits Debugging App to bind virtual devices
The following is the steps of binding the virtual device with the Gizwits Debugging App. Please keep your network available during the operation:

Step 1: Click “Show QR Code” in the red box of “Debug tips” to display the virtual device QR Code

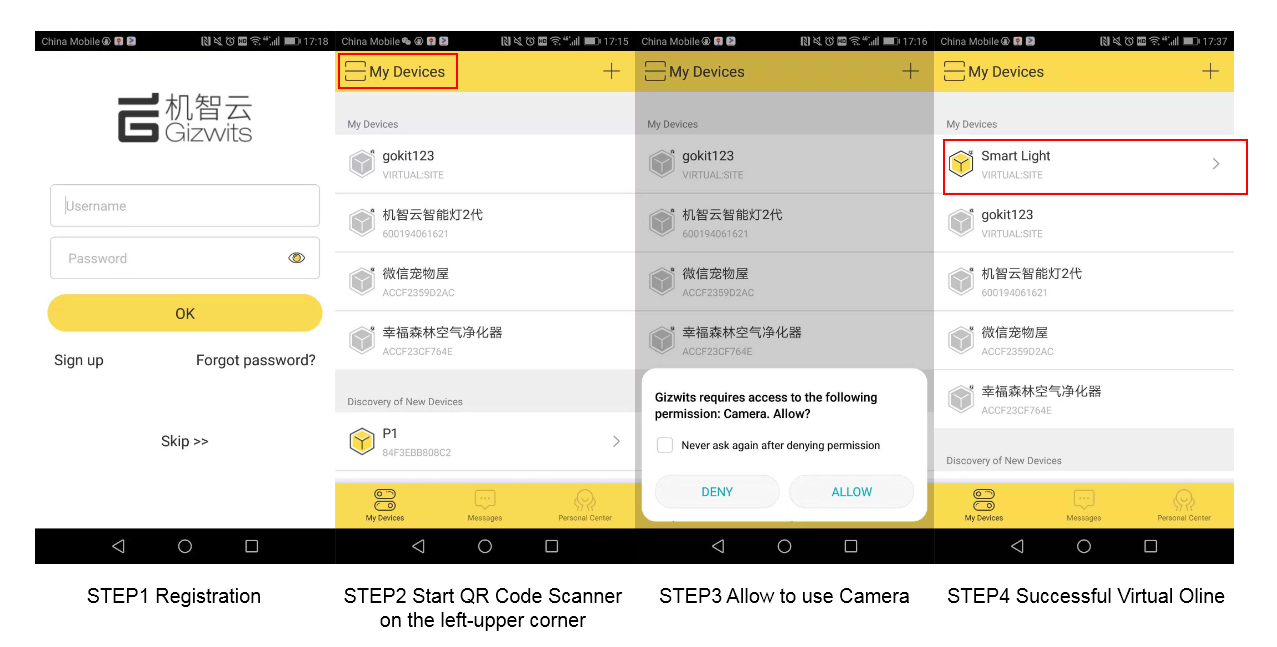
Step 2: Login in Gizwits Debugging App and bind the device

After using Gizwits Debugging App to scan the virtual device QR Code and binding the selected virtual device successfully, “Smart Light” will be showed in the “bound devices” of “My Devices” on the Debugging App.
Step 3: Control the virtual device using Gizwits Debugging App

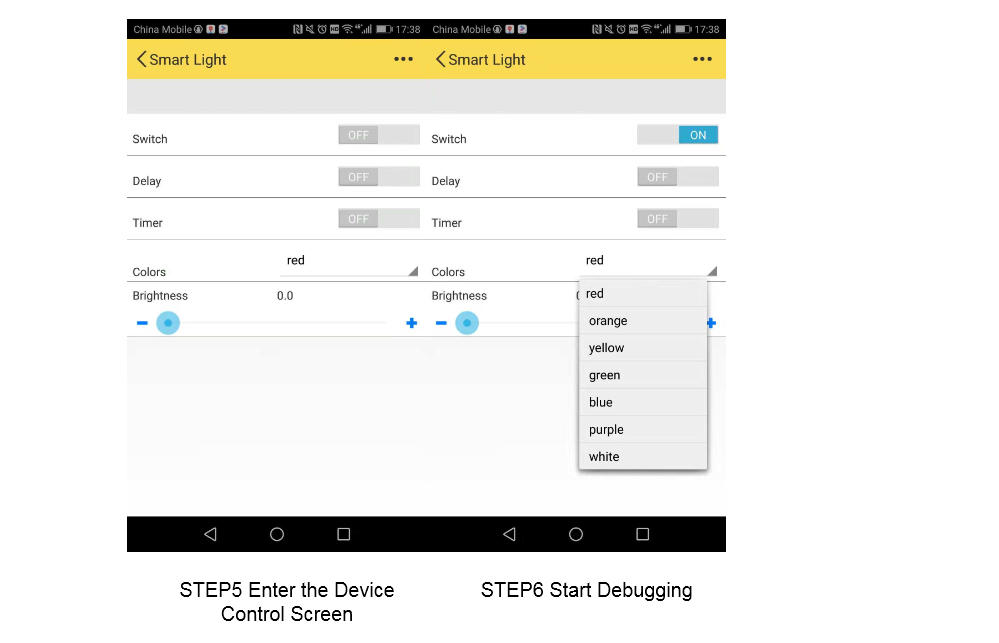
Click “Smart Light” in the red box to navigate to the debugging page of the virtual device. Take the “switch on/off” function as an example, set the “switch on/off” field of the smart light with 1.

At this point, you can see that the “switch on/off” field of the virtual device in the cloud is enabled and displayed as “1”. Meanwhile, “Communicating log” displays “Accept data sent by App” and automatically print the corresponding communication log.
(Note: Other operations can be performed following the above steps, you can try each of them one by one!)
4. Virtual devices reporting data to Gizwits Debugging App

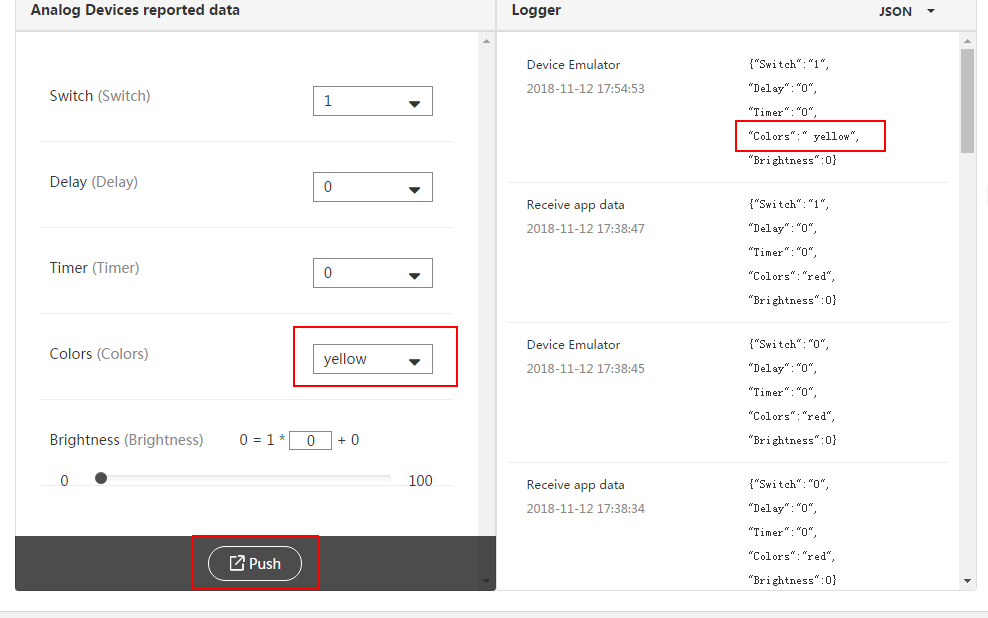
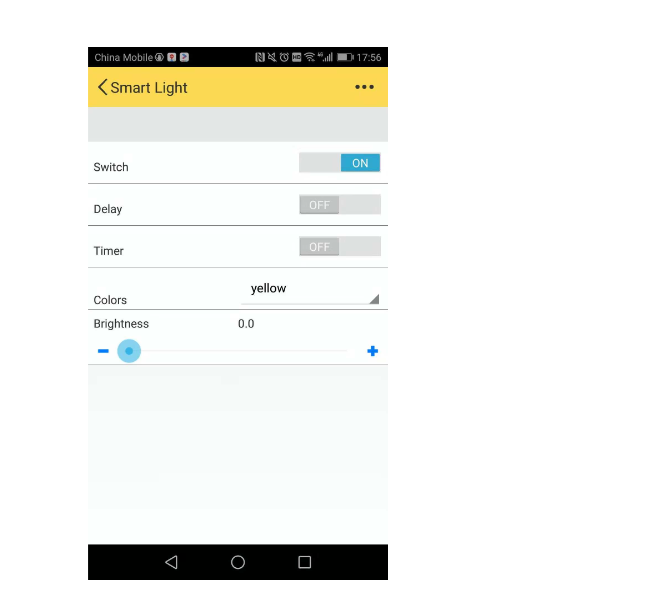
Set the “colors” of the virtual device in the cloud from “red” to “yellow”, and click the “push” button. The virtual device will report the data to the Gizwits Debugging App. You can see that the “colors” field on the Gizwits Debugging App has changed to be “yellow”. At the same time, “Virtual devices reporting data” will be displayed on the “Communication log” for the virtual device in the cloud, and the communication log will be printed automatically.
Gizwits Debugging App automatically updates its UI after receiving the data pushed by the virtual device.

(Note: Other operations can be performed following the above steps, you can try each of them one by one!)
OK, congratulations! You have quickly understood and experienced the connection service of Gizwits through the virtual device and Gizwits Debugging App. Now get started!
To learn about the device connection to Gizwits IoT Cloud, please click here.
To learn more about the rapid App development process, please click here.
To get Gizwits open source development kit - Gokit, please click here.
To join our developer community and talk with 120,000 developers, please click here.
 Docs
Docs

